This type of data is the most used in careers such as medicine, psychology, business administration, etc. to keep records of inventories, people and a lot of other things. The simplest way to organize a set of data is to order them from smallest to largest and present them in a table that we call a frequency distribution table. In this table, a number is associated with each data that represents the number of times a data is repeated in the set called the frequency (f) of the data. We will also see the graphical representation, which is using frequency histograms or frequency polygons.
Tabular representation of ordinal data
First, let’s say that we have certain data written down in a notebook and what we want to do is have a better organization with that data from some qualifications, the data is the following:
\begin{array}{c c c c c c c c c c} 8 & 9 & 6 & 7 & 5 & 7 & 8 & 5 & 9 & 10 \\ 6 & 7 & 5 & 9 & 10 & 10 & 9 & 8 & 7 & 8 \\ 9 & 9 & 8 & 9 & 6 & 5 & 10 & 10 & 7 & 7 \end{array}In order to construct an ORDERLY frequency distribution table for the 30 data, the number of times the 5, 6, 7, 8, 9 and 10 data are repeated must be counted. First we will use marks of five by five and then we will write one more column to place our frequency (f) and the sum of all the data is the sum of the frequency (\sum f).
\begin{array}{c l c} \text{Score} & \text{Counting} & f \\ 5 & \boldsymbol{||||} & 4 \\ 6 & \boldsymbol{|||} & 3\\ 7 & \boldsymbol{\cancel{||||}} \ \boldsymbol{|} & 6\\ 8 & \boldsymbol{\cancel{||||}} & 5 \\ 9 & \boldsymbol{\cancel{||||}} \ \boldsymbol{||} & 7 \\ 10 & \boldsymbol{\cancel{||||}} & 5\\ & & \sum f = 30 \end{array}Another way to write the data is in the form of relative frequency (f_{r}), which is obtained by dividing the frequency of each data by the total data or the sum of the frequency. Thus we have that the relative frequency is the value that represents the proportion of the number of times that a piece of data is repeated in the collection.
\begin{array}{c | c | c} \text{Score} & f & f_{r}\\ \hline 5 & 4 & 13\text{.}33 \\ 6 & 3 & 10\text{.}00 \\
7 & 6 & 20\text{.}00 \\ 8 & 5 & 16\text{.}66 \\ 9 & 7 & 23\text{.}33 \\ 10 & 5 & 16\text{.}66 \\ \hline
& \sum f = 30 & \sum f_{r} = 100\text{.}00 \end{array}
And we also have two other ways to represent the data in a table, one is the cumulative frequency (f_{c}) and the other is the relative cumulative frequency (f_{rc}):
\begin{array}{c | c | c | c } \text{Score} & f & f_{a} & f_{ar} \\ \hline 5 & 4 & 4 & 13\text{.}33 \\ 6 & 3 & 7 & 23\text{.}33 \\ 7 & 6 & 13 & 43\text{.}33 \\ 8 & 5 & 18 & 60\text{.}00 \\ 9 & 7 & 25 & 83\text{.}33 \\ 10 & 5 & 30 & 100\text{.}00 \end{array}Graphical representation of ordinal data
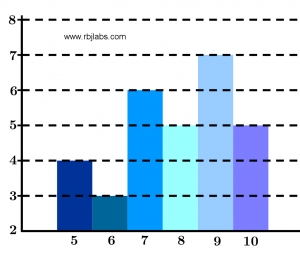
Frequency histogram
A frequency histogram is a graph that consists of a series of rectangles that have their bases of equal length on the horizontal axis and the data is placed in the center of each rectangle and the heights of each rectangle are the frequencies corresponding to the data represented on the vertical axis.
In Figure 1 you can see an example of a frequency histogram where the data shown above was placed:
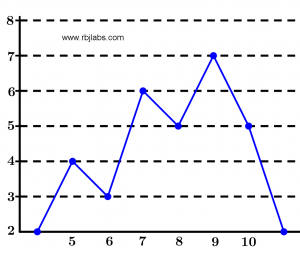
Frequency polygon
This graph is similar to the frequency histogram, except that instead of making rectangles, the points that represent each data are joined. It can be said that it is the union of the highest parts of each of the rectangles of the histogram, only that to build the polygon well we have to start and end at zero.
Next I present in Figure 2 an example of the frequency polygon using the data mentioned above:
Conclusion
The imagination has no limits, both in the histogram and in the polygon the relative frequencies, the percentage relative frequencies, the accumulated frequencies, the sum of the frequencies, etc. can be placed on the vertical axis.
These graphs are nothing more to place the data and its frequencies, although it is what it is used the most, but you can use them as mentioned in the previous paragraph.
Thank you for being in this moment with us : )